Switching with TIPS Example

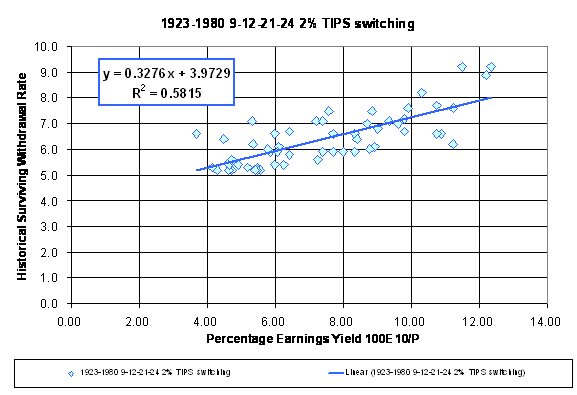
I took this from my Yahoo Briefcase. The x-axis shows the initial percentage earnings yield 100E10/P. The y-axis shows the 30-year Historical Surviving Withdrawal Rate assuming withdrawals that grow at the inflation rate. The graph shows the effect of varying allocations in accordance with P/E10 (switching, a form of Valuation Informed Indexing) during the intermediate years. The lowest historical rate was around 5% (plus inflation).
The Safe Withdrawal Rate is the lower confidence limit of the scatter, which is 0.8% below the line.
Today’s P/E10 is 23. The percentage earnings yield 100E10/P is 4.3%. The value of the (regression) line is 5.4%. The Safe Withdrawal Rate is 4.6%.
This is better than the 4.0% (plus inflation) that is often claimed when using fixed allocations. By training on the Scenario Surfer, you can quickly learn how to withdraw 5.0% (plus inflation) safely.
Have fun.
John Walter Russell
August 10, 2008
|
