|
Switching DI optimized stock allocation switching for today’s valuations on the Investment Strategy Tester. I call this version Switching D. I have now generated 30-year Historical Surviving Withdrawal Rates for sequences starting in 1923-1980. SettingsThe P/E10 thresholds for Switching D are 8-10-18-30. The stock allocations are 100-80-50-20-0% respectively. That is, the stock allocation is 100% when P/E10 is below 8. It is 80% when P/E10 is between 8 and 10. And so forth. GraphThis picture shows the 30-year Historical Surviving Withdrawal Rates HSWR of Switching D starting from 1923-1980. 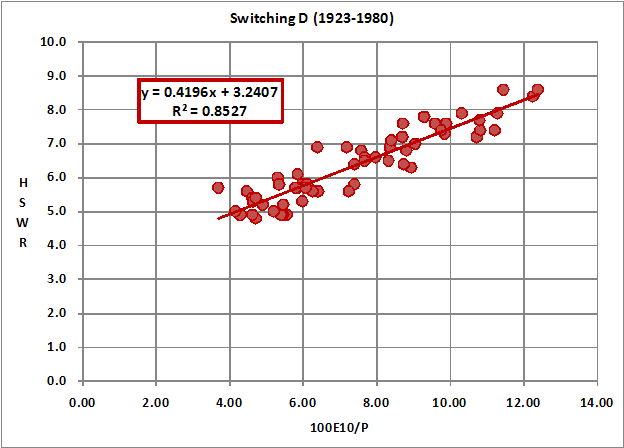
ComparisonI have plotted Switching C and Switching D side by side. Switching C, which uses P/E10 thresholds of 10-18-30 and stock allocations of 100-80-20-0% is better. 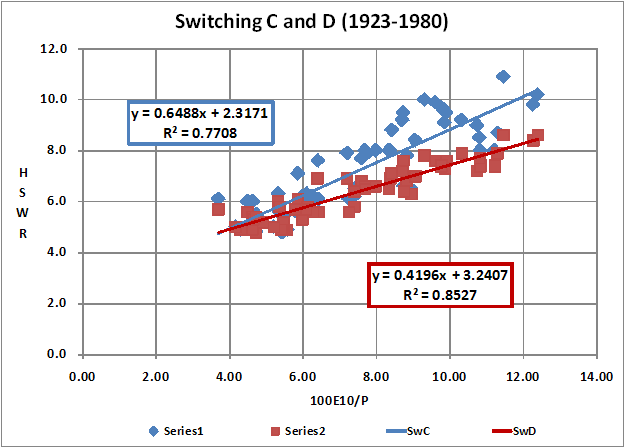
ObservationsThis comparison highlights the advantage of a non-symmetrical approach. Switching C has a high stock allocation at mid-range valuations. Switching D is optimized for the first few years of a Bear Market. Switching D waits for the best valuations and then holds back after the turning point. A much better choice would be to retain a high stock allocation after the initial drop in a Bear Market. This was the idea behind the old Latch and Hold investigations. |