|
SwOptT2 Returns GraphsHere are graphs of SwOptT2 annualized, real, total returns. SwOptT2SwOptT2 is optimized for periods of high valuations. It maximizes the 30-year Safe Withdrawal Rate by shifting allocations with P/E10. GraphsHere are the Year 10, 20 and 30 annualized, real, total returns of SwOptT2 compared with that of a portfolio with a 50%-50% fixed allocation. The non-stock component is 2% TIPS. 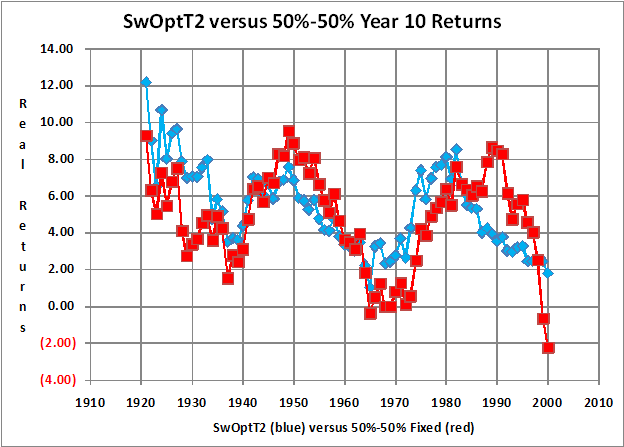
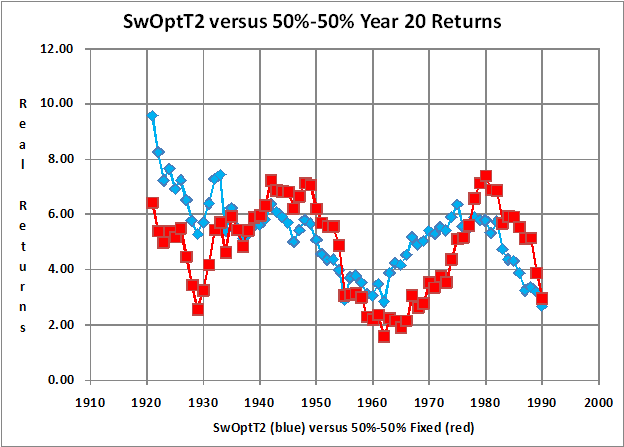
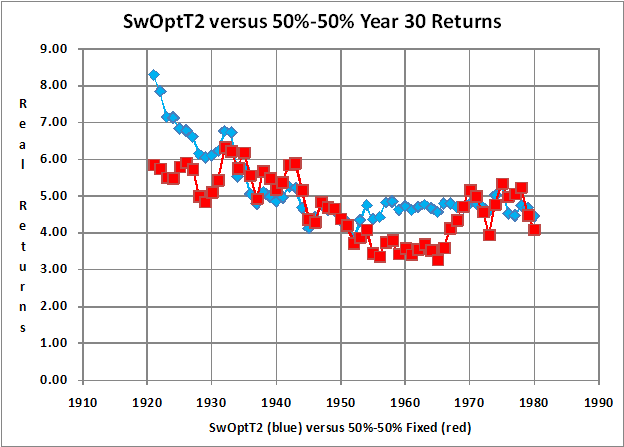
ObservationsSuperficially, there is very little difference between SwAT2 and a fixed allocation. For the retiree at times of high valuations, it is the difference between financial success and a busted retirement. |