|
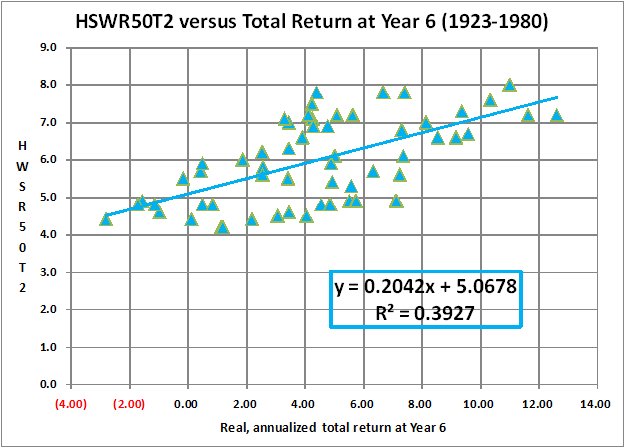
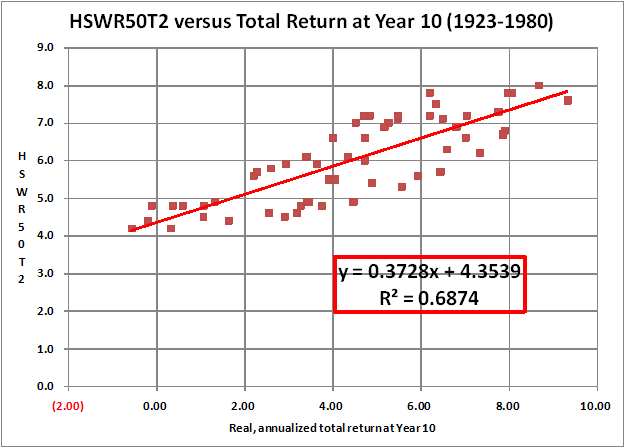
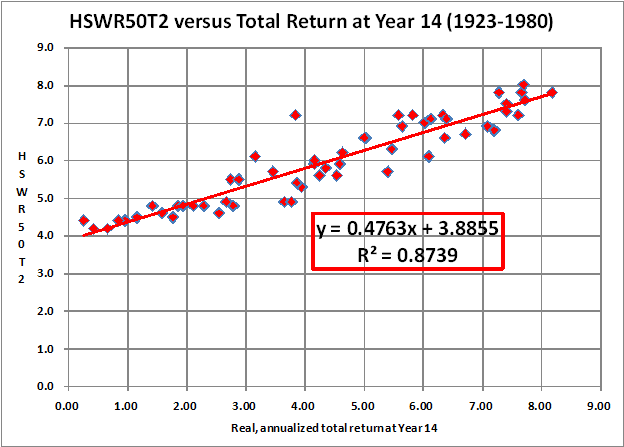
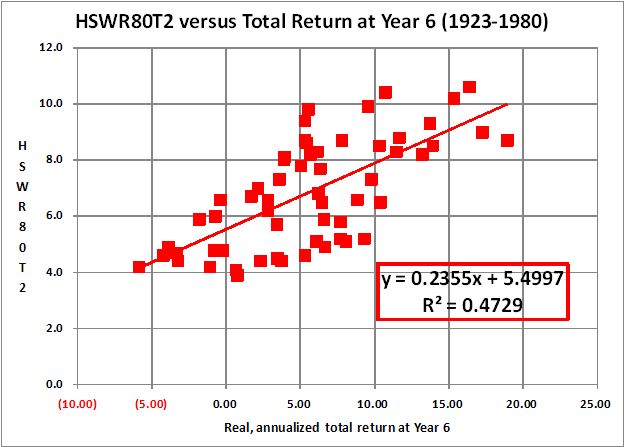
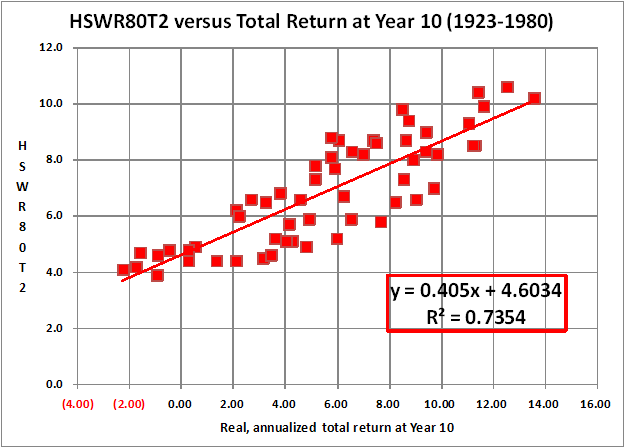
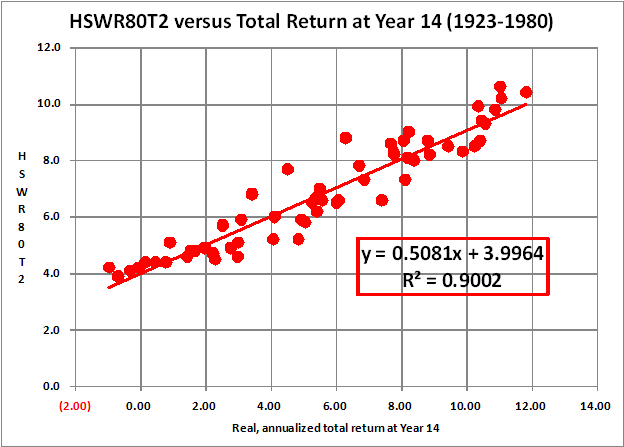
SWR Translator GraphsHere are SWR Translator graphs. They show 30-Year Historical Surviving Withdrawal Rates HSWR versus the portfolio’s real, annualized total return at Years 6, 10 and 14. HSWR50T2HSWR50T2 has a fixed 50% stock (S&P500) allocation. The non-stock component is TIPS at a real interest rate of 2%. Expenses are 0.20% of the current balance. HSWR80T2HSWR80T2 has a fixed 80% stock (S&P500) allocation. The non-stock component is TIPS at a real interest rate of 2%. Expenses are 0.20% of the current balance. |
