|
More Switching C Returns GraphsHere are additional graphs of Switching C real, annualized, total returns. Switching CSwitching C optimizes Year 10 returns when P/E10=14 in a long lasting (secular) Bear Market. GraphsHere are the Year 10, 20 and 30 annualized, real, total returns of Switching C compared with that of a portfolio with an all-stock portfolio. The non-stock component is 2% TIPS. 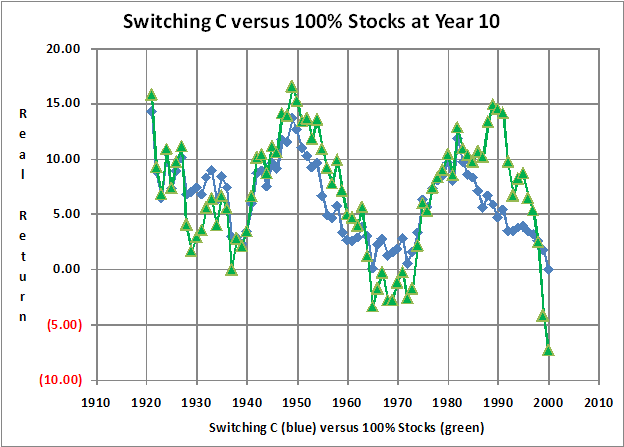
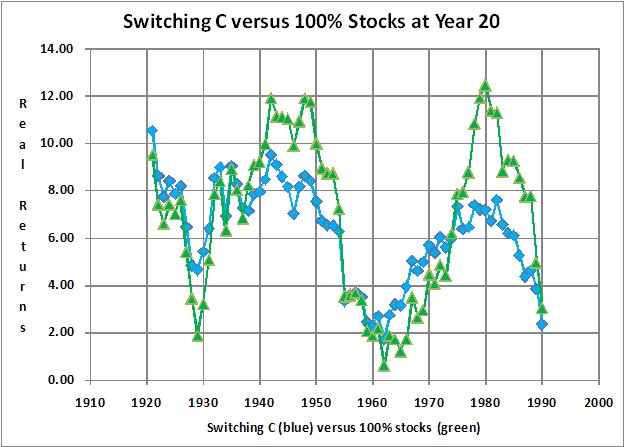
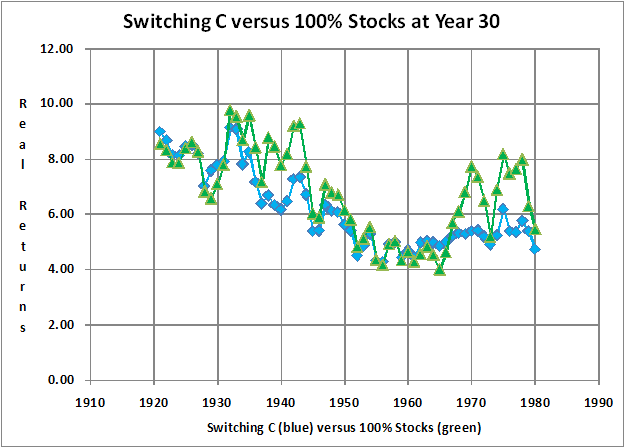
ObservationsSwitching C satisfies its criteria. It is safer than an all-stock fixed allocation at Year 10. It delivers comparable results while limiting the downside risk. It even delivers comparable returns at Year 30. |