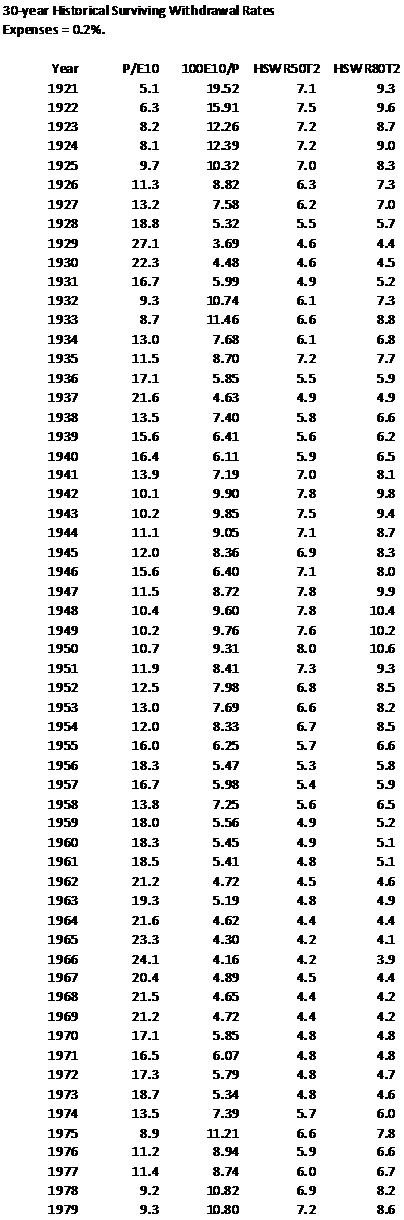
Home
Notes
Notes
Notes
Notes
Notes
Notes
Notes
Notes Index
Short Posts
P/E10
Stock Returns
Year 30 SWR
Year 15 SWR
Scenario Surfer
Strategy Tester
TIPS Table
S&P500 Dividends
S&P500 Returns
Graphs
More Graphs
Guidelines
Dividend Guidelines
Foundations
May Highlights
Lucky-7 Archives
Current Research N
Current Research O
Current Research P
Current Research Q
Current Research R
Current Re Index
Archives
Dividend Archives
 Books
Contact Us
Letters Index
Letters
Letters
Letters
Letters
Letters
Letters
Letters

HSWRxxT2 Data

These are the data for the graphs of HSWR50T2 and HSWR80T2 30-Year Historical Surviving Withdrawal Rates HSWR versus the percentage earnings yield 100E10/P.

HSWR50T2 has a fixed 50% stock (S%P500) allocation. HSWR80T2 has a fixed 80% stock (S&P500) allocation. The non-stock component is TIPS at a real interest rate of 2%. Expenses are 0.20% of the current balance.

The graphs are generated from the 1923-1980 data.


Have fun.

John Walter Russell
September 25, 2008