A Glimpse at P/E10=8

Stock prices may bottom within the next decade. It is at least 50%-50% that P/E10 will fall below 10. But what if P/E10 falls below 8? Imagine the bargains.

Year 30 Safe Withdrawal Rates

I brought up the Year 30 SWR Retirement Risk Evaluator. Here are the Year 30 Safe Withdrawal Rates at P/E10=8 with fixed allocations and 2% TIPS.

20% rebalanced: 5.3%.
50% rebalanced: 7.3%.
80% rebalanced: 9.1%.

Scenario Surfer Runs

I invested entirely in stocks and TIPS. I started with a $100000 balance. I selected P/E10=8 Normal Market. I withdrew $9000 (plus inflation) each year. I set the TIPS interest rate to 2.0%. Here are the Year 30 balances. I have included fixed allocation results for comparison.

Run 1. 200,293.
20% rebalanced: bankrupt in year 15.
50% rebalanced: bankrupt in year 21.
80% rebalanced: 90,143.

Run 2. 90,480.
20% rebalanced: bankrupt in year 15.
50% rebalanced: bankrupt in year 21.
80% rebalanced: 37,044.

Run 3. bankrupt in year 27.
20% rebalanced: bankrupt in year 14.
50% rebalanced: bankrupt in year 18.
80% rebalanced: bankrupt in year 28.

Run 4. 333,816.
20% rebalanced: bankrupt in year 16.
50% rebalanced: bankrupt in year 24.
80% rebalanced: 154,956.

Run 5. 110,024.
20% rebalanced: bankrupt in year 15.
50% rebalanced: bankrupt in year 22.
80% rebalanced: 53,150.

Income Using a Constant Percentage of the Current Balance

I brought up the Deluxe Calculator V1.1A08a. I withdrew 9% of the current balance. I looked at all historical sequences that started with P/E10 values below 9. The only years meeting this criterion were 1918-1924, 1933, 1975, 1980 and 1982-1983. The four year average income fell below 8% of the initial balance (adjusted for inflation) at Year 20 in the historical sequences beginning in 1922, 1923, 1924, 1933 and 1975.

The average income from the 1975 sequence fell to 6.6% of the initial balance (plus inflation) at Year 10. It was 6.4% at Year 20. In contrast, the average income from 1980, 1982 and 1983 held up well throughout.

Discussion

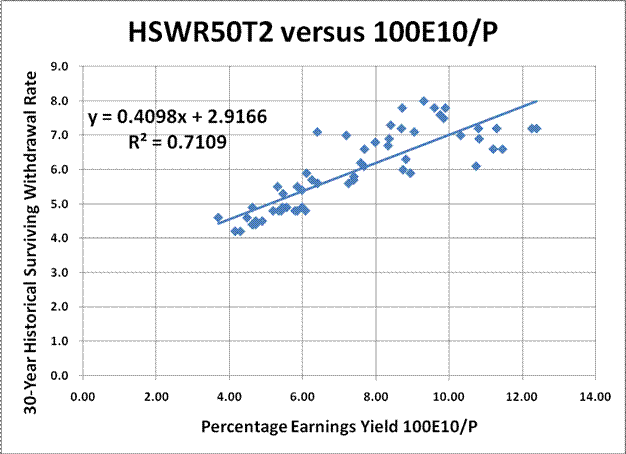
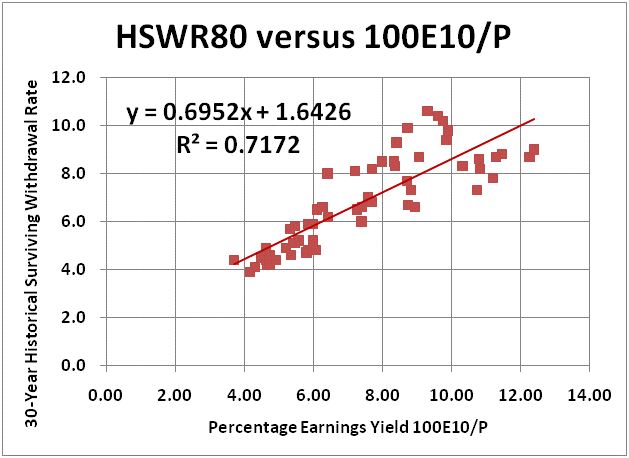
The slight discrepancy in Safe Withdrawal Rates is because of a subtle detail in the design of the Year 30 SWR calculator. It assumes a fixed spread as valuations change. This is not really true. The spread of historical surviving withdrawal rates is almost constant with P/E10, but it increases steadily with the reciprocal 100E10/P. You can see this in the HSWR50T2 Graph and the HSWR80T2 Graph.


The Year 30 SWR Retirement Risk Evaluator and Scenario Surfer agree that you should use high stock allocations when P/E10 starts out at 8. The advantage in Valuation Informed Indexing is explained in part by an initial stock allocation of 100%.

In 1975, 1980, 1982 and 1983, the S&P500 dividend yields were 5.0%, 5.1%, 5.7% and 4.8%. Quality companies with higher than average dividends pay even more. It would be reasonable to plan for a continuing withdrawal rate of 8% to 10% per year using a dividend strategy if P/E10=8. Dividend approaches are superior to withdrawing a constant percentage of the current balance.

Have fun.

John Walter Russell
October 19, 2008